MC displays information in several places as tables of entries having various parameters or meta-information. Such filter windows are used to display firewall rules, Application-level Gateway logs, active connections, and so on. The common properties and handling of these tables is summarized in this section.
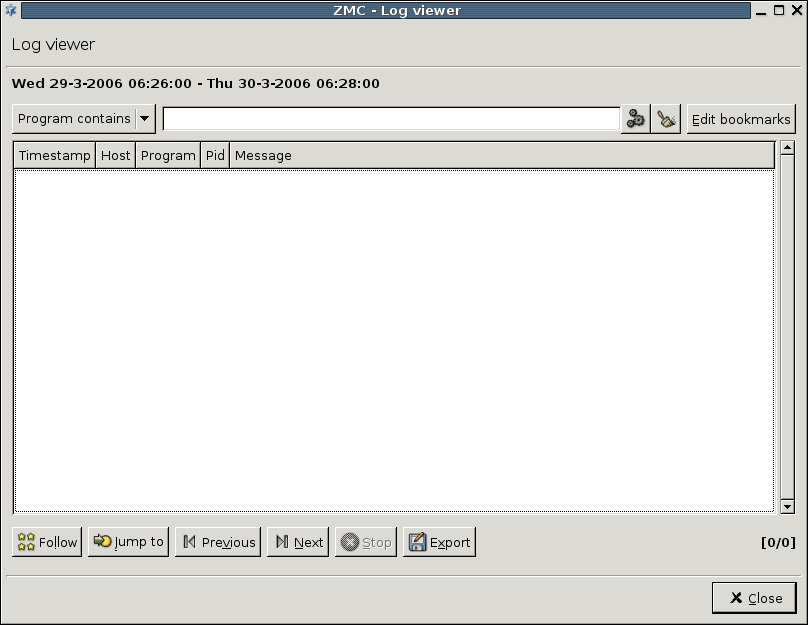
Filter windows consist of three main parts:
Filter bar
Table displaying the entries
Command bar to perform various actions on the selected entries
The actions available in the command bar are described at the documentation of the actual component using the filter window (for example, Log viewer).
Each entry of the table consist of a single row, with the various parameters displayed in labeled columns.
To sort the entries, click on the column headers.
To modify the order of the columns, drag the column header to its desired place.
To hide a single column, right-click on the column header and click .
To configure the columns to be displayed, right-click on the column header and click , select a column and move it with the arrow. Click .
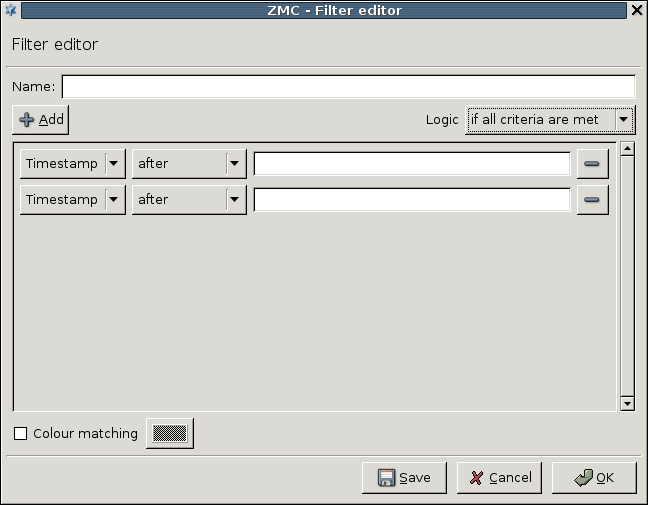
To filter the entries, use the filter bar located above the table. The specifies the column to search for the expression (string or regular expression) that you type in the field. To search, click . To restore the full list, click . To create custom filter expressions, selecting the option as . The filter expressions can also be combined using the logical AND () and OR () operations. You can run custom filters once (click ), or you can bookmark them for repeated use (click ).
| Tip |
|---|
To display the dialog with the latest advanced filter, click . |
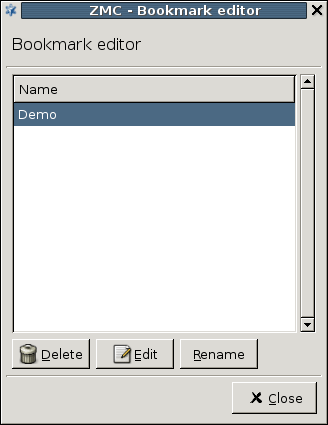
Saved filters are also displayed in the combobox. To manage saved filters (delete, rename and edit), click .
In some cases (for example, in the Log viewer), you can configure advanced filters to highlight the entries matching the filter expression. To configure highlighting, select and set the color of the highlighting.
| Tip |
|---|
By assigning different colors to different bookmarked filters, the important elements of the table can be highlighted in several colors. |
Published on June 04, 2020
© 2007-2019 BalaSys
Send your comments to support@balasys.hu


